Residents:
x   population
2   120
5   300
9   180
14  220
20  160

Expected Output:
Optimal hospital position = 9
Total weighted distance = 2680
2. School Allocation to Students
Algorithm: Dijkstra + Greedy Assignment (Heap)
Problem Content
Assign students to schools minimizing travel time while respecting school capacities and zones.
Algorithmic Solution
Run Dijkstra from each school or multi-source; create a min-heap of (distance, student, school) triples and greedily assign while decreasing capacities.
Input / Output (Project Version)
Input: street graph, student nodes, school nodes with capacities. Output: assignments and total travel cost.
Schools:
S1 (capacity = 2)
S2 (capacity = 3)

Students and Distances:
Student   S1   S2
A         4    6
B         2    3
C         5    1
D         3    4
E         6    2

Expected Output:
Student → School allocation
Minimum total travel distance
3. Smart Parking Slot Allocation
Algorithm: Greedy Assignment + Trie for permit lookup
Problem Content
Assign incoming cars to parking slots to minimize walking distance while handling reserved permits and accessibility constraints.
Algorithmic Solution
Form feasible (car,slot,distance) triples, sort by distance and greedily match. Use a Trie for permit prefix matching to restrict reserved slots.
Input / Output (Project Version)
Input: cars list (coords + permit), slots (coords + reservedPrefix or -). Output: assignments and total walking distance.
Related SDGs
SDG 11 — Sustainable CitiesSDG 9 — Industry & Infrastructure
Land Parcels (Nodes):
0, 1, 2, 3, 4, 5

Adjacency (conflict edges):
0 - 1
1 - 2
2 - 3
3 - 4
4 - 5

Expected Output:
Valid zoning using 2 colors
No adjacent parcels share the same zone
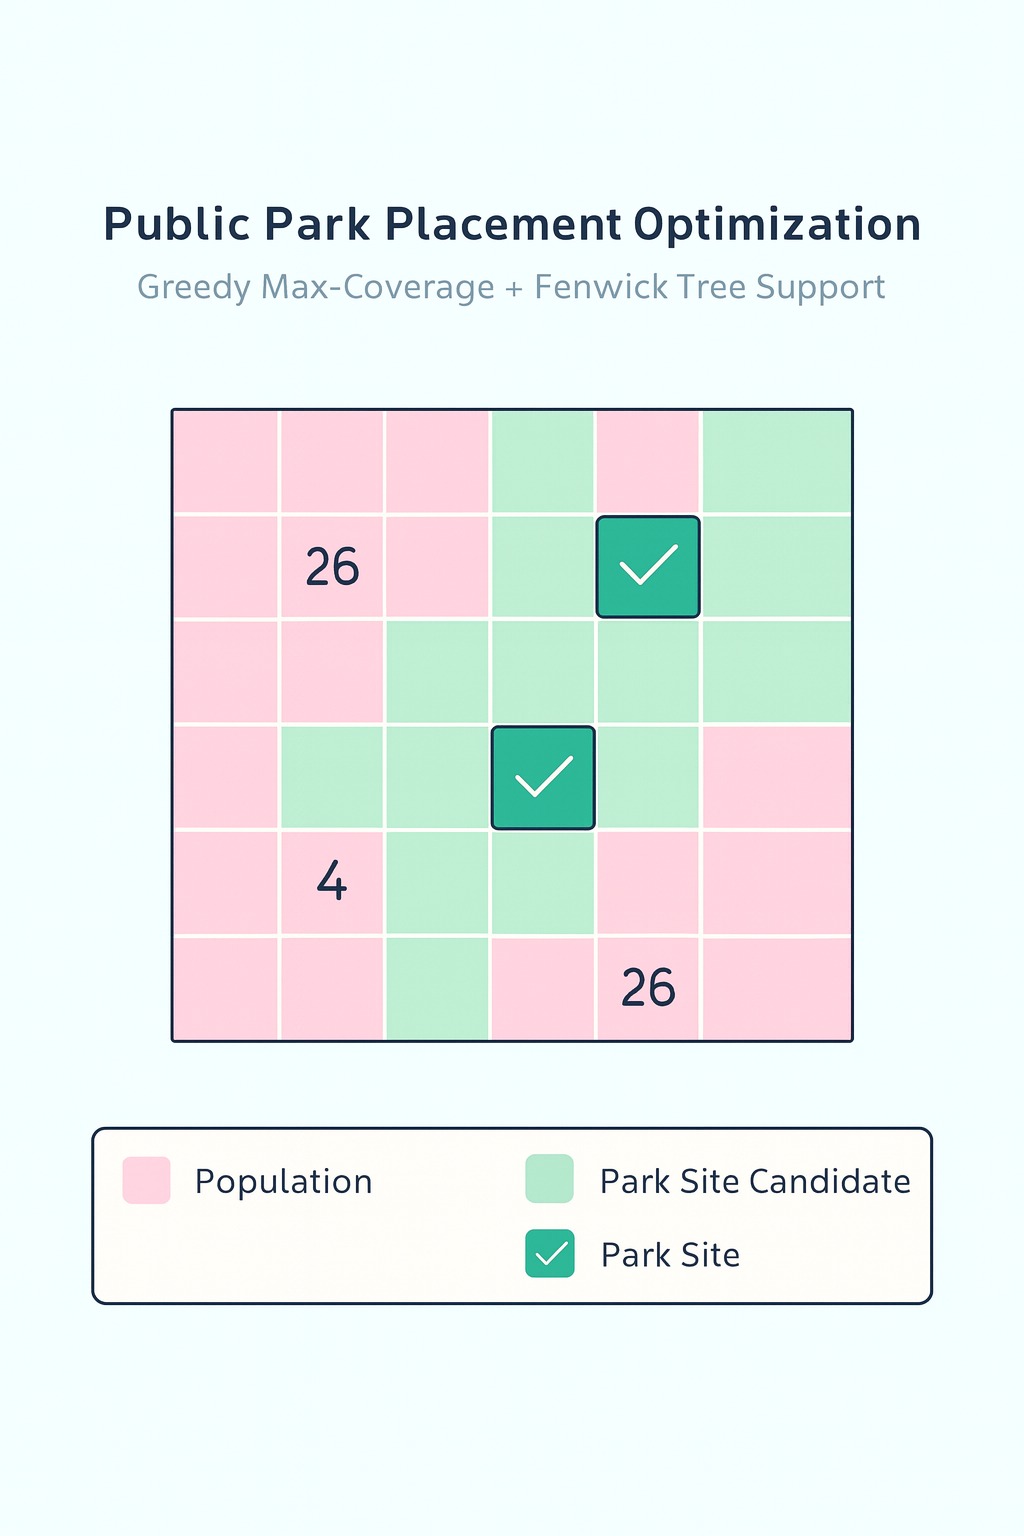
5. Public Park Placement Optimization
Algorithm: Greedy Max-Coverage + Fenwick tree support
Problem Content
Select k park sites from candidates to maximize covered population within walking radius, ensuring equity.
Algorithmic Solution
For each candidate precompute which population points it covers; greedily pick candidate with largest uncovered population (Fenwick/segment trees speed updates).
Input / Output (Project Version)
Input: candidate coords, population grid/points, k. Output: chosen sites and covered population.
Related SDGs
SDG 11 — Sustainable CitiesSDG 3 — Good Health
📷 Click to View Image
C++ Example (Greedy + Fenwick skeleton)
// Greedy Max-Coverage skeleton
#include <bits/stdc++.h>
using namespace std;
struct Fenwick { int n; vector bit; Fenwick(int n=0):n(n),bit(n+1,0){}; void add(int i,long long v){ for(++i;i<=n;i+=i&-i) bit[i]+=v; } long long sum(int i){ long long r=0; for(++i;i>0;i-=i&-i) r+=bit[i]; return r; } };
int main(){
  int P,C,k; cin>>P>>C>>k;
  vector<pair w(P);
  for(int i=0;i<P;i++) cin>>pts[i].first>>pts[i].second>>w[i];
  vector<pair>cand[i].first>>cand[i].second;
  int r; cin>>r;
  vector<vectorbestgain){ bestgain=gain; best=i; }
    }
    if(best==-1) break;
    chosen.push_back(best);
    for(int p:covers[best]) covered[p]=true;
  }
  long long total=0; for(int i=0;i<P;i++) if(covered[i]) total+=w[i];
  cout << "Chosen sites: "; for(int x:chosen) cout << x << " "; cout << "\\nCovered pop: " << total << "\\n";
}
Population Centers:
P1 (2,2)  Population = 100
P2 (5,5)  Population = 200
P3 (7,7)  Population = 150

Candidate Park Locations:
L1 (3,3)
L2 (6,6)
L3 (8,8)

Parameters:
k = 2 parks
coverage radius = 3 units

Expected Output:
Selected park locations maximizing population coverage
Total covered population
6. Land Subdivision Optimization
Algorithm: Divide & Conquer.
Problem Content
Partition land parcels into balanced subplots while keeping constraints like minimum area and road access.
Algorithmic Solution
Compute polygon area via shoelace formula and recursively partition along axes to approximate equal-area subplots.
Input / Output (Project Version)
Input: polygon boundary points. Output: sub-polygons with areas and centroids.
Related SDGs
SDG 11 — Sustainable CitiesSDG 15 — Life on Land
📷 Click to View Image
C++ Example
// formula skeleton
#include <bits/stdc++.h>
using namespace std;
double polygon_area(const vector<pair>n; vector<pair>poly[i].first>>poly[i].second; cout << polygon_area(poly) << "\\n"; }
Land Boundary (Polygon Coordinates):
(0,0)
(6,0)
(6,4)
(0,4)

Task:
Divide the land into balanced sub-plots

Expected Output:
Total Area = 24 units²
Balanced land subdivision
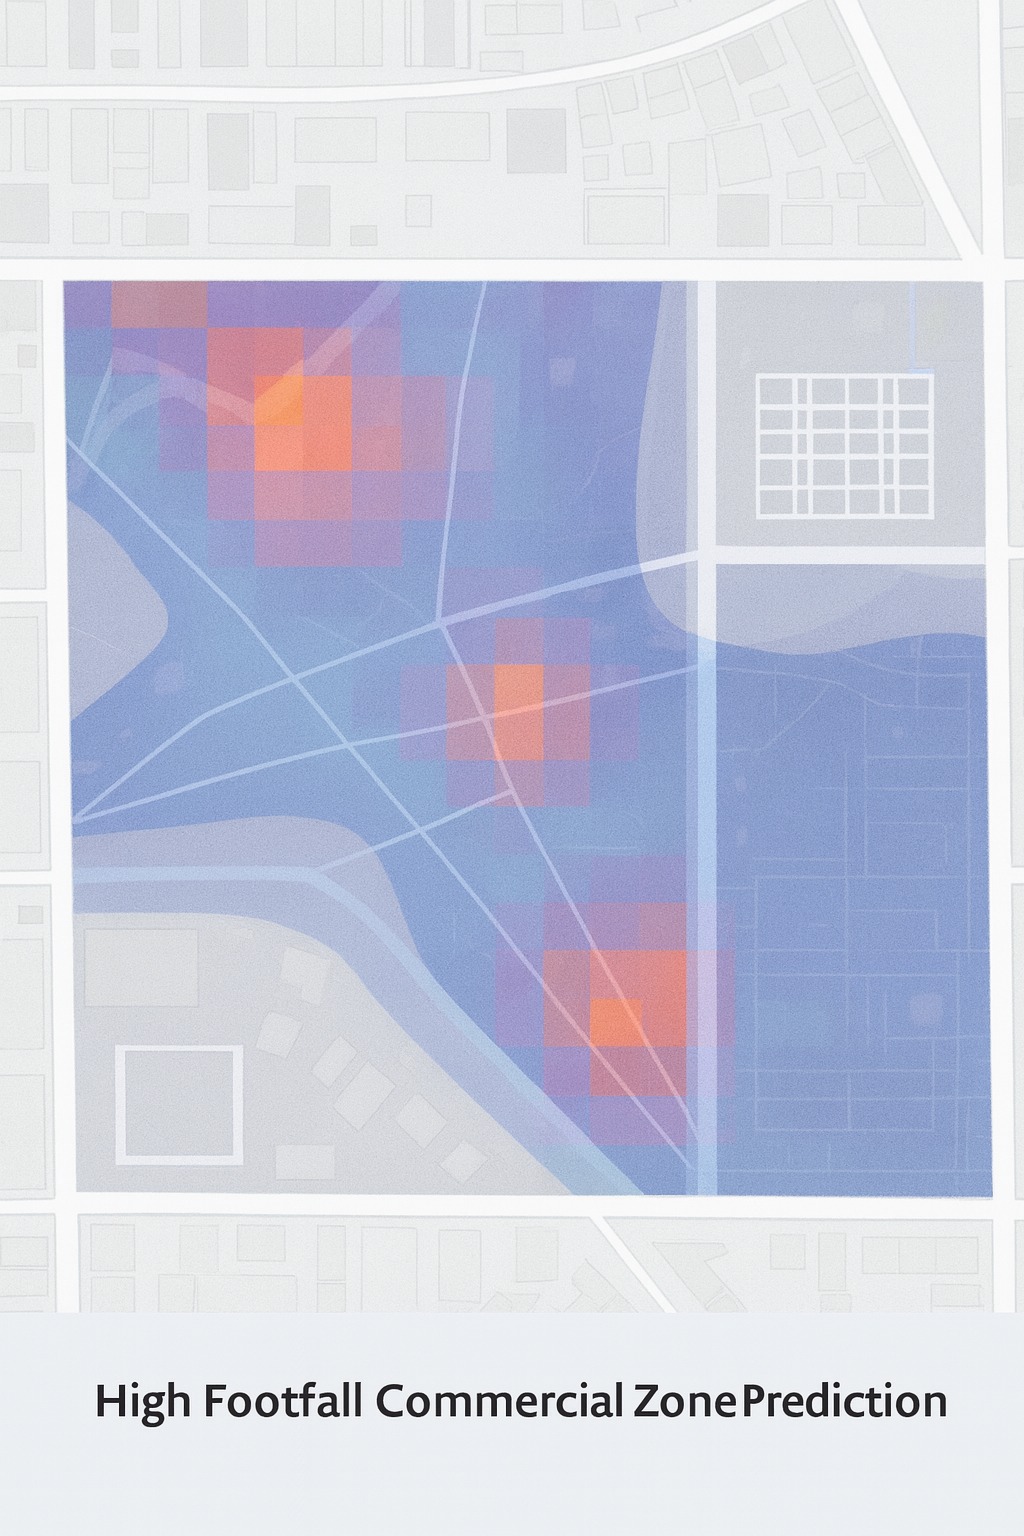
7. High Footfall Commercial Zone Prediction
Algorithm: Grid Binning + 2D Prefix Sums
Problem Content
Analyze movement traces and POI density to identify likely commercial hotspots for transit planning and services.
Algorithmic Solution
Bin traces into grid cells, build 2D prefix sums for fast rectangle queries, and sort candidate cells by aggregated counts.
Input / Output (Project Version)
Input: movement traces (x,y), POI data. Output: ranked hotspot cells and suggested interventions.
// 2D prefix sums skeleton
#include <bits/stdc++.h>
using namespace std;
int main(){
  int W,H; cin>>W>>H; int T; cin>>T;
  vector<vector(W,0));
  for(int i=0;i<T;i++){ int x,y; cin>>x>>y; if(x>=0&&x<W&&y>=0&&y<H) grid[y][x]++; }
  vector<vector(W+1,0));
  for(int r=1;r<=H;r++) for(int c=1;c<=W;c++) ps[r][c]=grid[r-1][c-1]+ps[r-1][c]+ps[r][c-1]-ps[r-1][c-1];
  int k; cin>>k; vector<pair
Bus Stops:
A, B, C, D, E

Passenger Count:
A  50
B  30
C  40
D  20
E  60

Distances (in km):
A-B  4
B-C  3
C-D  5
D-E  2
A-E  9

Expected Output:
Optimal bus route covering all stops
Minimum total travel distance
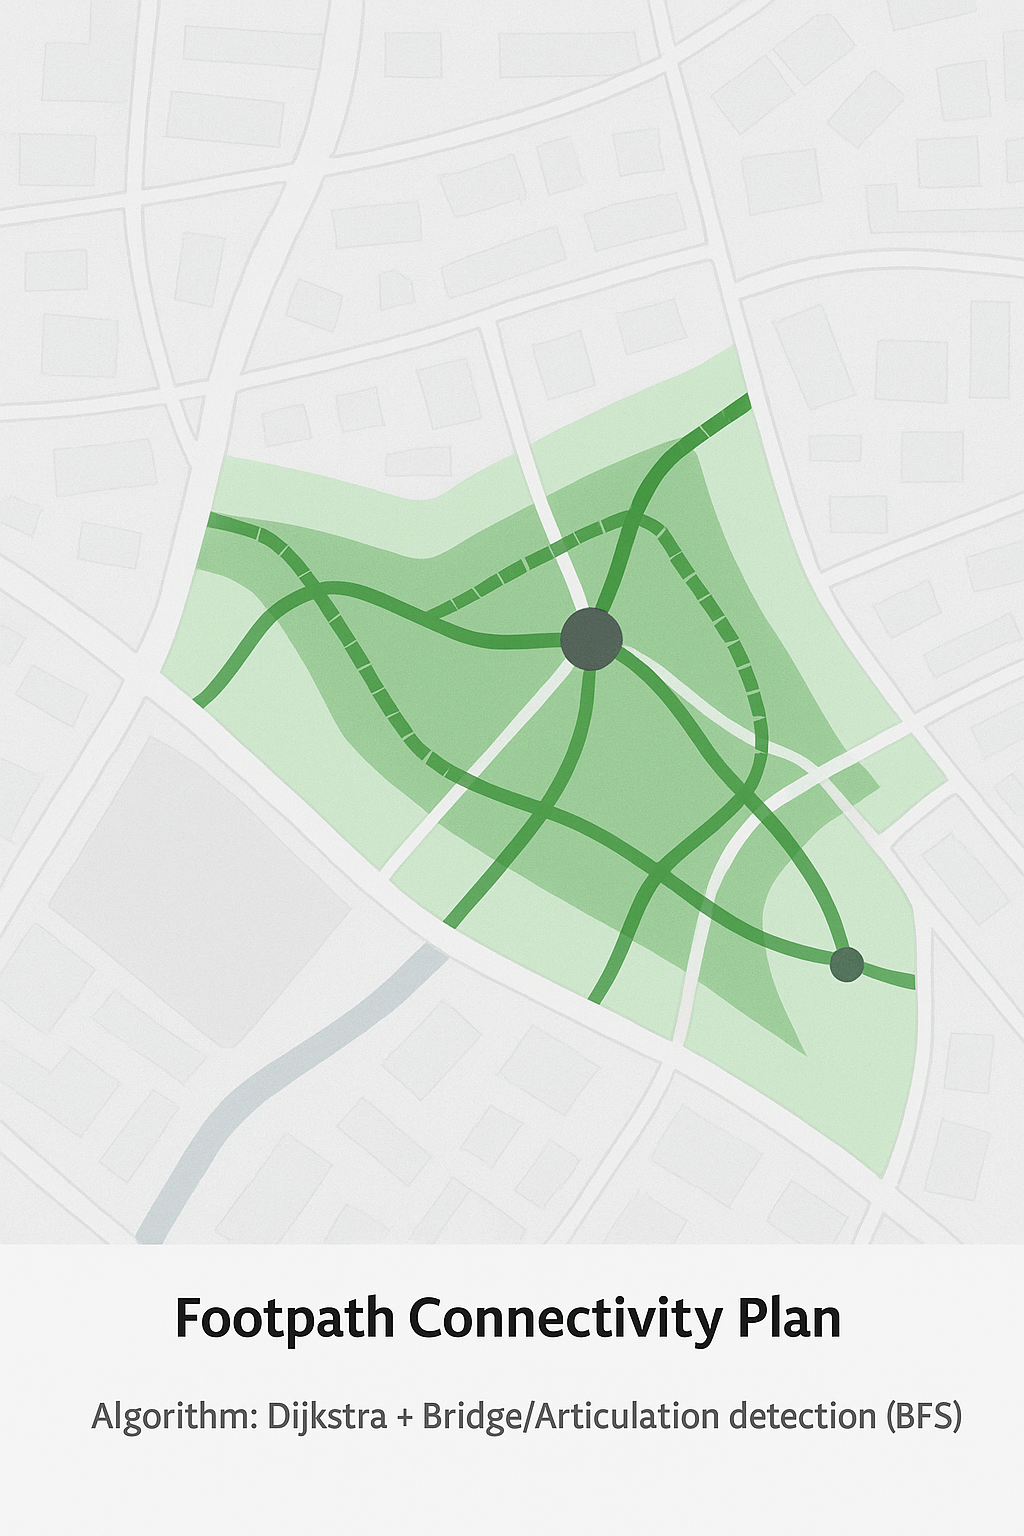
Detect disconnected pedestrian networks, compute safe shortest routes, and suggest minimal new links to restore or improve connectivity.
Algorithmic Solution
Use DFS to find bridges/articulation points (fragile connections) and Dijkstra for safe shortest paths; recommend added edges using union-find / MST on candidate connections.
Input / Output (Project Version)
Input: pedestrian network graph. Output: bridges, articulation points, and suggested new links.
Emergency Units:
E1
E2

Service Areas:
Area A
Area B
Area C
Area D

Response Time (minutes):
E1 → A = 5
E1 → B = 7
E1 → C = 6
E1 → D = 8

E2 → A = 6
E2 → B = 4
E2 → C = 5
E2 → D = 7

Expected Output:
Assignment of emergency units to areas
Minimum maximum response time
Data / input files prepared:JSON, CSV, and plain text formats
Figures / diagrams: 10+ (one per project case study)
Each module includes: time & space complexity notes in comments
Design Techniques Used
Divide and Conquer
Greedy Method
Dynamic Programming
Backtracking
Graph Algorithms
Brute Force
Heuristics
Optimization Techniquess
B. SDG Mapping Summary
SDG 4 – Quality Education: Algorithms are documented, structured, and explained to support enhanced learning and academic clarity.
SDG 8 – Decent Work & Economic Growth: Efficient algorithm design improves productivity, optimization, and computational performance.
SDG 9 – Industry, Innovation & Infrastructure: Use of structured problem-solving and optimized data processing supports innovation and technical development.
Shortest Job First (SJF) Scheduling — Prioritizes tasks with the smallest execution time.
Priority Scheduling — Executes tasks based on assigned priority levels.
E. Implementation Notes & Best Practices
All code is implemented using clean and portable C++ STL constructs (vectors, lists, sets, maps, priority queues) to ensure maintainability.
Each algorithm block contains a short explanation, time/space complexity, and simple input–output examples for clarity.
Data handling is standardized using lightweight JSON/CSV/plain-text samples to allow quick switching to real datasets.
Functions are written as independent modules, making reuse and debugging significantly easier.
Consistent naming conventions and indentation are followed throughout the codebase for readability.
Boundary conditions and edge cases are handled explicitly to avoid hidden runtime errors.
Comments are added only where logic becomes non-trivial, keeping the code clean yet understandable.
Algorithmic choices are based on performance considerations, ensuring optimal time and memory usage for each problem.
Document all assumptions, constraints, and edge-case considerations clearly within the codebase.
F Usage & Integration
Save this single HTML file (you already have it) and the images/ folder with placeholder images image1.jpg..image10.jpg. To switch between the main portfolio and this technical documentation, use the sidebar link "Technical Documentation & SDG Mapping" or the "Back to Portfolio" control in the header.