View the city as an algorithmic map. Each zone is one DAA case study.
City Network Overview
Infrastructure & Network Optimization using core DAA algorithms.
Algorithm Zone
The city is expanding with several new townships. Each pair of major junctions has an estimated road construction cost (land, materials, labour). If engineers connect junctions in an ad-hoc manner, they may create redundant loops, overspend the budget, and still leave some junctions disconnected.
We need a backbone road layout that connects all junctions with the minimum possible total cost, while guaranteeing that every junction is reachable from every other one.
The road network is modeled as a weighted, undirected graph G(V, E), where junctions are vertices and candidate roads are edges weighted by construction cost.
Both algorithms should yield the same total cost, which validates correctness.
Input: Junction list and road list with construction costs.
Output: Set of roads forming the MST and the minimum total cost.
SDG 9.1: Sustainable infrastructure planning.
SDG 11.2: Accessible and connected transport networks.
Minimum Spanning Trees are used in power grids, water pipelines, fiber networks, and computer networks to design cost-efficient backbones.

During peak office hours, shortest-distance routes are not always the fastest. Narrow roads may be congested, while slightly longer ring roads may provide quicker travel.
Citizens require a routing system that minimises travel time, not physical distance.
The city is represented as a directed, weighted graph where edge weights represent travel time in minutes.
Input: Road network with time costs and a source zone.
Output: Minimum travel time and path to each zone.
SDG 11.2: Sustainable urban mobility.
SDG 9.C: Smart transport infrastructure.
Shortest-path algorithms are the foundation of navigation systems, logistics routing, and communication networks.

Fixed and equal green times at a multi-road junction cause inefficient traffic flow. Some directions remain congested while others are underutilised, leading to increased waiting time, fuel consumption, and emissions.
The goal is to dynamically allocate green time based on real-time traffic demand measured as queue length at each lane.
Each lane at the junction is represented using a queue of vehicles. At the start of each signal cycle, queue lengths are measured.
Input: Queue length per lane and total signal cycle time.
Output: Optimised green time allocation for each lane.
SDG 11.2: Efficient urban transport systems.
SDG 11.6: Reduced environmental impact of cities.
Queue-based scheduling is widely used in CPU scheduling, network packet handling, and call-center optimisation. Priority queues allow fast adaptation to changing load.

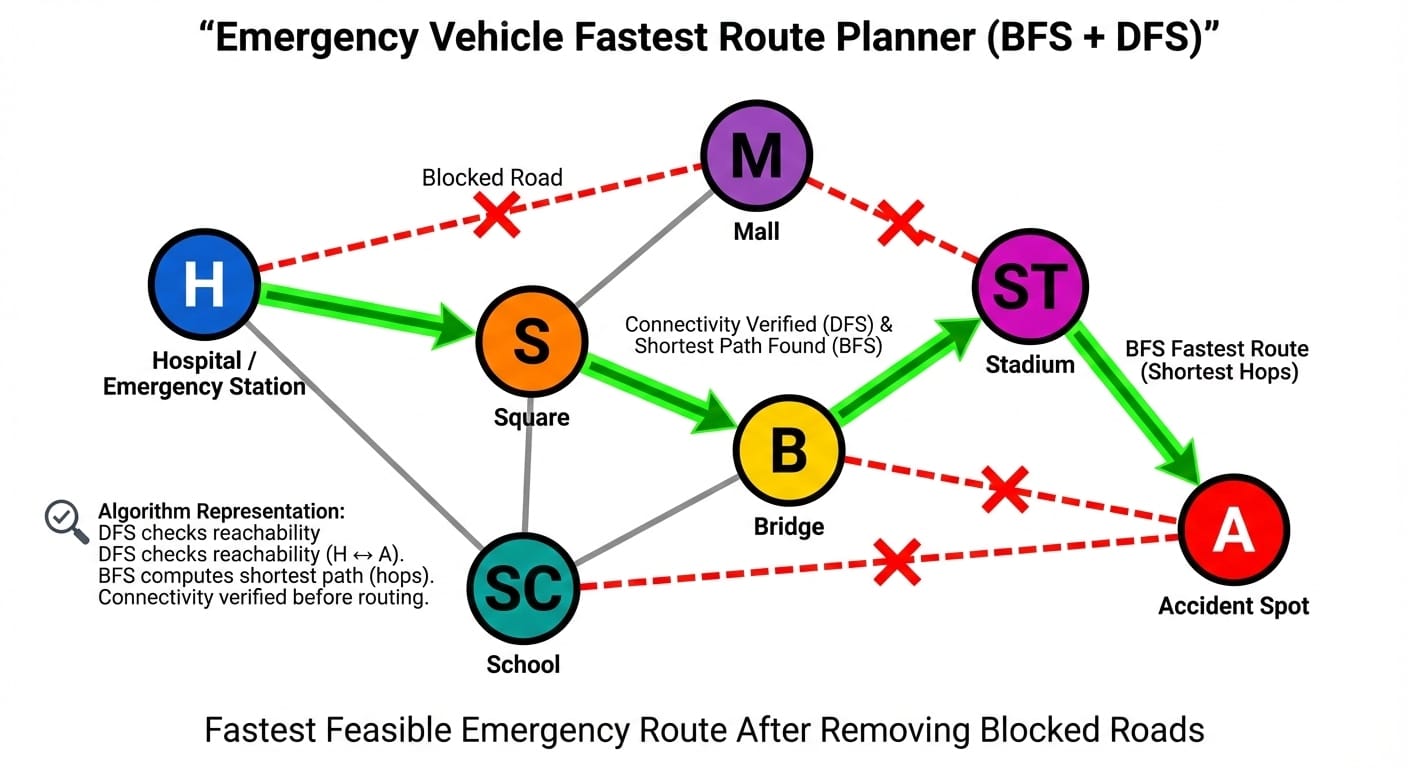
During medical emergencies or accidents, normal traffic routes may be blocked due to congestion, road work, or accidents. Emergency vehicles must quickly determine which routes are still usable.
The road network is treated as an unweighted graph after removing blocked edges.
This approach runs in O(V + E) time and is suitable for rapid response.
Input: Road graph, blocked roads, source and destination nodes.
Output: Fastest feasible route or indication that none exists.
SDG 3: Good health and well-being.
SDG 11.5: Disaster and emergency resilience.
BFS and DFS are foundational graph algorithms used in routing, network reliability, and state-space search problems.
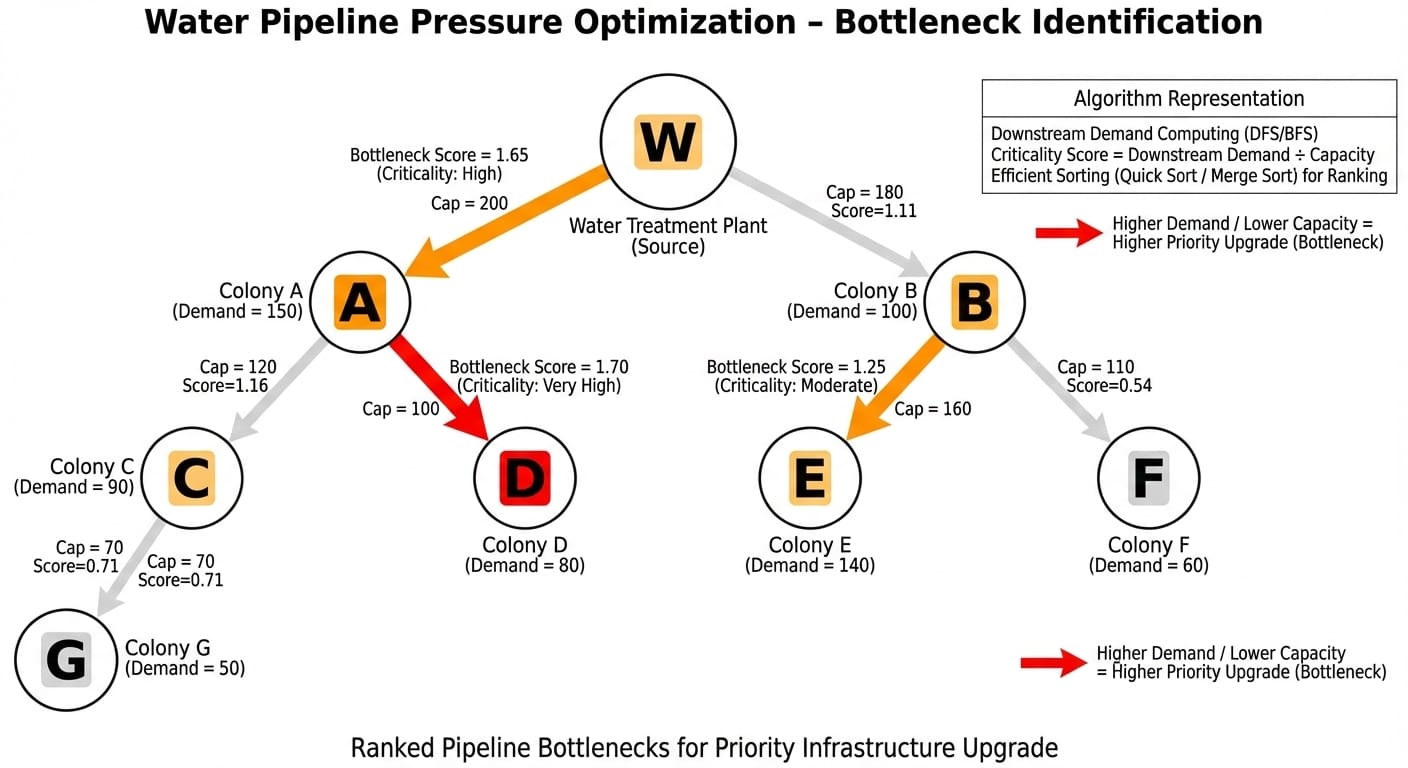
In a city’s water distribution network, trunk pipelines feed several residential branches. During peak hours, some tail-end colonies receive very low water pressure, while others receive excess supply. Budget constraints make it impossible to upgrade all pipelines at once.
The objective is to identify the most critical pipelines (bottlenecks) so that upgrades can be prioritised for maximum improvement in water pressure.
The pipeline network is modeled as a directed graph where nodes represent junctions and edges represent pipelines with capacity constraints.
The highest-ranked pipelines are flagged as bottlenecks for immediate upgrade.
Input: Pipeline graph, capacities, and consumer demand values.
Output: Sorted list of pipelines by criticality.
SDG 6.1: Access to safe drinking water.
SDG 9.1: Sustainable infrastructure investment.
Combining graph traversal with sorting is a common pattern in infrastructure analysis. Similar techniques are used to prioritise road repairs, power line upgrades, and communication network expansions.
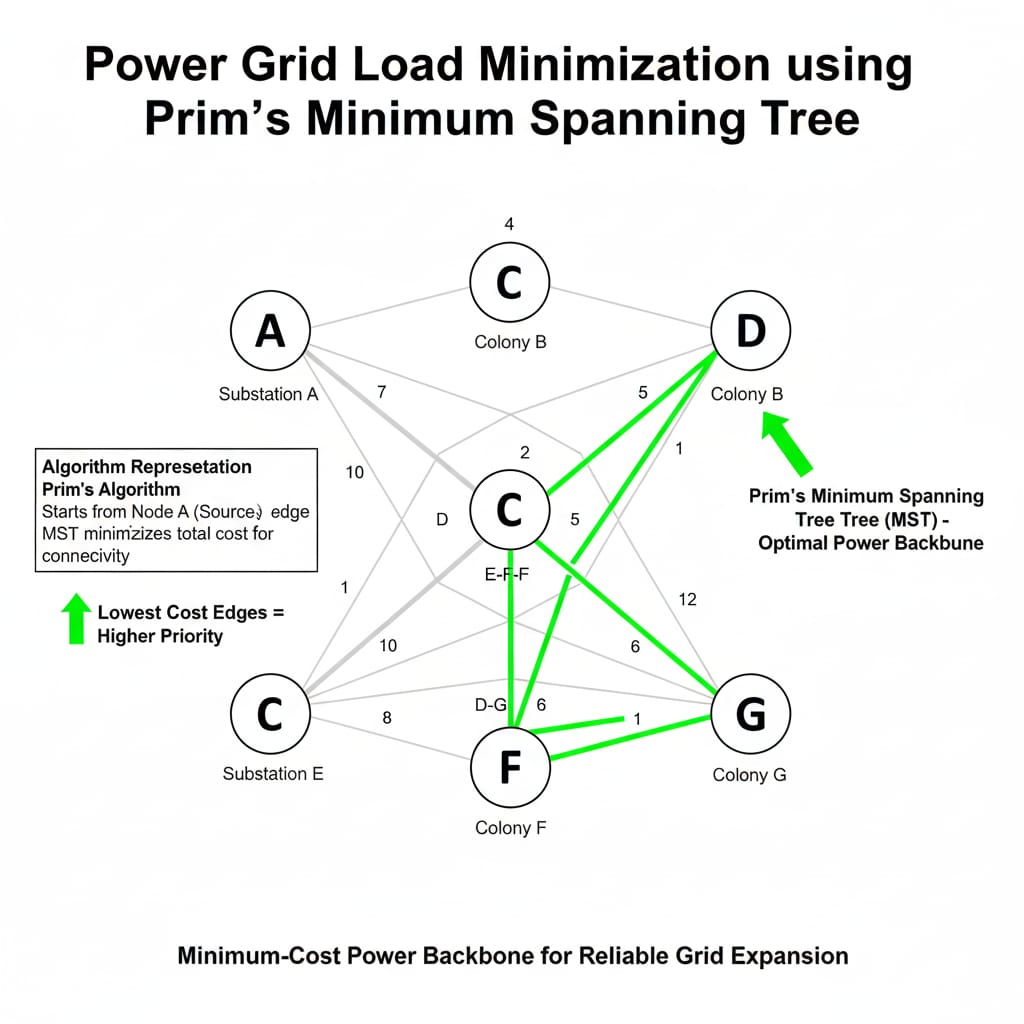
As new residential and commercial areas are developed, they must be connected to the existing power grid. Multiple candidate cable routes exist, each with associated cost and transmission loss.
The goal is to connect all substations and colonies with minimal total cost while ensuring reliable power delivery.
The power network is modeled as a weighted, undirected graph where nodes are substations and edges are transmission lines weighted by cost and loss.
The resulting MST represents an efficient backbone for the expanded power grid.
Input: Graph of substations with transmission line weights.
Output: Selected power lines and total grid expansion cost.
SDG 7: Affordable and clean energy.
SDG 9: Reliable infrastructure.
MST-based planning is widely used in designing electrical grids, cable networks, and large-scale distribution systems.
Garbage collection trucks often follow manually designed routes that are repeated every day without considering changes in traffic conditions or ward layouts. This leads to unnecessary fuel consumption, longer collection times, and uneven service quality.
The objective is to compute an efficient route that visits all pickup points while keeping the total travel distance as small as possible.
Instead of solving the full Travelling Salesperson Problem (which is NP-hard), a practical approximation strategy is used:
This hybrid approach produces good-quality routes efficiently for small to medium wards.
Input: Pickup locations, depot location, and road network distances.
Output: Ordered garbage collection route and total travel distance.
SDG 11.6: Efficient waste management.
SDG 13: Reduced emissions through optimised routing.
Greedy routing heuristics combined with shortest-path algorithms are widely used in logistics, courier services, school bus routing, and last-mile delivery systems.

Urban bus fleets are limited, but the demand for trips is high throughout the day. Poor scheduling can lead to idle buses during peak demand or overlapping assignments.
The goal is to generate a timetable that maximises the number of non-overlapping trips handled by each bus.
Each candidate bus trip is modeled as a time interval [start, end].
This algorithm is optimal for interval scheduling and is simple to implement.
Input: List of bus trips with start and end times.
Output: Maximum set of non-overlapping trips assigned to a bus.
SDG 11.2: Improved public transport reliability.
SDG 9.4: Efficient use of transport resources.
Interval scheduling is used in CPU scheduling, exam timetables, classroom allocation, and reservation systems where resource conflicts must be avoided.

Some bridges and elevated roads are so critical that their failure would disconnect entire regions of the city from hospitals, schools, or business hubs. Identifying such links is essential for maintenance prioritisation.
The city road network is modeled as an undirected graph. A DFS-based bridge detection algorithm is applied:
low[v] > disc[u].Bridges are ranked and marked for inspection and reinforcement.
Input: Graph of regions and connecting bridges.
Output: List of critical bridges.
SDG 9: Resilient infrastructure
SDG 11: Safe and sustainable cities
Bridge detection is widely used in communication networks, power grids, and transport planning to identify single points of failure.

During heavy rainfall, floods originate from rivers or lakes and spread to nearby localities. Authorities need to identify which shelters remain reachable before roads are submerged.
Flood spread is modeled using multi-source BFS:
This ensures optimal time computation in O(V + E).
Input: City graph, flood sources, shelters, time threshold.
Output: Flood arrival times and shelter safety status.
SDG 11.5: Disaster risk reduction
SDG 13: Climate action
Multi-source BFS is used in modeling floods, fire spread, disease outbreaks, and information propagation across networks.

Each problem uses a structured 20-row CSV dataset mapped directly to algorithm inputs such as nodes, edges, weights, queue sizes, or timestamps.
Time and space complexity are analysed using Big-O notation. Worst-case scenarios are discussed in plain text aligned with the Design and Analysis of Algorithms syllabus.
SDGs covered include 3, 6, 7, 9, 11, and 13. Each algorithm contributes directly to sustainability, resilience, and smart-city planning.
All implementations are original C++ programs using STL only. No third-party libraries or frameworks are used.